 Skip to main contentSkip to footer
When it comes to losing money, I don’t mean to brag. However, when you lose over $10,000 from a mistake that could have been avoided, it would be a total waste to keep this lesson to ourselves.
In this AirDNA review I’m going to cover what it is, who it’s for, and what impact it made for us that helped our business.
Our story regarding AirDNA and how we turned around our AirBnB rental is worth telling, because you’ll be able to avoid the same pitfalls we did when choosing and setting up your property.
To be clear, we feel that AirDNA is a critical tool for market research. In this article you’re going to learn how we lost $10,000, what we did wrong, and how we used AirDNA to find gaps in our market.
Now, I’m not saying that AirDNA is a perfect tool by any means.
In fact, if you just take the data at face value, like we did, then you can dig yourself into a pretty deep hole…like we did.
But if you wield this tool properly, you will avoid charging in blind and can set yourself up for success. Here’s what happened with us.
Summary

Table of Contents
Unlock the Secret to Maximizing Your Airbnb Revenue
- AirDNA is a market research company that pulls data from over 4,000,000 listings on AirBnB/Vrbo/Homeaway in over 80,000 different cities.
- Average Price: $19.95-$99.95/mo
- AirDNA is best for property investors, rental arbitrists, and short term rental hosts.
- AirDNA shows data regarding seasonality, market growth, average revenue, occupancy, etc. at a glance.
- AirDNA shows specific performance data based on number of bedrooms and number of guests.
- Looking for a second opinion? Check out our post on 7 AirDNA Alternatives and the AirDNA Rentalizer.

Our Story, From The Beginning
Imagine you had quit your job and were making a go with a new business in rental arbitrage, risking it all.
Then you find yourself struggling to stay occupied, trying everything you can to move the needle only to find out that the information you had been looking for was already available the whole time – and just confirmed what you already discovered.
How would you feel?
There we were: bright eyed and bushy tailed with a new adventure ahead of us. The wind was at our back and our sails were adjusted forward, setting off into the sunsets of financial freedom.
At least that’s what the ads told us.
You know the ones we’re talking about? The ads from some big “gurus” talking about how much money you can make by renting out someones property and putting it on AirBnB?
Yeah, that one!
Thing is, this idea wasn’t new to me.
For years I’ve often wondered if the idea of rental arbitrage held any water when I saw vacant properties with signs in the yard. “Rent me!” They called to me, but I never really looked into it.
Until I saw the ads.
“I knew it!” echoed through my mind, feeling like I had just wasted years on a good idea that I failed to execute.
An Opportunity For Rental Arbitrage Presents Itself
Fast forward a few months when I had quit my job in the water industry (a story for another time, perhaps), I came upon an opportunity to do just that: rent someones property and put it on AirBnB.
The logistics weren’t clear and I had yet to run the numbers, but I knew it was a unique opportunity.
The kind that you don’t want to pass up.
We had to make a decision quickly, because the landlord was also needing to do background checks on long term tenants that were also interested in the property.
So we thought about it, prayed about it, and ultimately felt at peace about the whole situation.
By this point I had already known about AirDNA and the importance of doing your due diligence, but I felt it wasn’t really necessary. We were going to go through with it despite what the numbers were.
In fact, the free report on AirDNA showed that the area was actually pretty decent for an AirBnB.
At first glance, anyway.
Getting Our Property Listed Before The Evergreen State Fair Ended
Furniture, internet, kitchen items, insurance, etc. It was all a blur. We had a lot of things to buy, and a $20 report was not on the list – so I brushed it off.
Big mistake.
Had I looked at the numbers more closely, I would have discovered that there would be no way this property made sense with the rent/expenses we were about to pay.
The Evergreen State Fair was a big deal and is one of the largest events of the year in our area. Summer time attracts a lot of travelers from all over the United States, including shopkeepers selling their wares that don’t want to travel from Seattle every day.
All of our efforts went in to getting our property listed before the fair ended so we could scoop up any bookings and reviews as fast as possible.
It worked. But all good things must come to an end.
Occupancy Significantly Dropped Off
Eventually the fair ended, taking any profit to be had with it. The wind in our sails started to turn, and we soon found ourselves going backwards.
We did everything we could think of to move the needle to at least break even.
At first it started with our furniture. We realized that people weren’t booking our place because it looked nice, but because it was the only one available.
Then we realized that we had to make a change to the quality of our photos, a service that we now provide.
We didn’t realize how much money we left on the table by having sub-par pictures taken from our cellphone. After all, everyone else has them and they seem to be doing just fine.
Right?
So we spent some time taking our own professional AirBnB photos and improving our image.
That also worked. We saw an increase in traffic to our listing, as well as an increase in bookings, but it still wasn’t enough.
We Finally Purchased The AirDNA Report For Our Area
Maybe it was stubbornness. Maybe it was Maybelline.
A few months go by and pieces of the puzzle are starting to come together. Out of desperation we finally decided to get the AirDNA report for our area, to see if we were just bad at AirBnB.
The numbers looked like we were severely under-performing compared to our competitors, which was disheartening.
I couldn’t understand why the average listing was occupied all the time! We had more bedrooms and slept more people, so how could it be that we were vacant?!
However, digging deeper we discovered that we were actually doing really well for the type of property we had. And we were able to verify our own internal data, seeing our numbers in the report!
What We Discovered: A Closer Look At Our Property
I went through the numbers, one by one. It was too overwhelming to get the bigger picture from the data I was looking at, so I created an Excel sheet to make sense of it all.
I went line by line, property type by property type, and charted all of their revenue, occupancy, and nightly rates. I spent hours locked away in my chambers like a mad scientist conducting an experiment.
And what I discovered made my heart sink into my stomach:

Just let this sink in.
We can confirm the occupancy and revenue too, although it is off by 10’s of dollars – but only Reddit would care about that.
What Does This AirDNA Data Mean?
We had assumed that a 2 bedroom apartment was going to do well in this town, year round. What’s more, we thought that the number of heads we could sleep would also boost our occupancy.
The more the better, as the guru’s would tell you.
We were wrong!
If you’re having trouble understanding what all these numbers mean, let me show you what I see:
- We had a 2 bedroom apartment that slept 5 guests, and enjoyed an 18% occupancy.
- We were the 90th percentile, meaning we did better than 90% of other 2 bedroom listings that slept 5 guests.
- 2 bedroom listings with 4 guests dropped their prices as low as $35/night to increase occupancy. They did triple the work/cleaning for not even double the revenue.
- 1 bedroom listings performed much better with only 2 guests.
- We would have had to be above the 75th percentile to break even, which had a 95% occupancy.
- A 1 bedroom that slept 6 guests had double the revenue of a 2 bedroom that slept 7!
To see that we were the 90th percentile with only 18% occupancy was devastating. But it also gave us hope that we were doing the right things, just with the wrong property.
Further down the line, it became clear that 3+ bedroom properties were the clear opportunities that made double and triple the revenue of the 1 bedroom listings, despite sleeping the same amount of guests as the highest 2 bedroom.
More importantly, this meant that all we could hope for was to break even until the summer no matter what we did.
Had we seen this data before signing on the dotted line, I doubt we would have even gone through with the deal in the first place.
It would have prevented a lot of sleepless nights, to say the least.
Our First Data Driven Decision
So what is someone supposed to do with all of this new information?
The picture that this painted was clear and took us months of discovery to learn on our own, but it confirmed that something needed to change.
Sleeping more heads wasn’t going to be it.
As crazy as the idea sounded, we did the only thing we were able to do with a 2 bedroom property. We locked off a bedroom and changed our listing to a 1 bedroom.
All of a sudden we started getting more bookings and our occupancy doubled, from 18%-40%!
Bookings Really Picked Up When We Added This Amenity
But a 40% occupancy at $90/night is still only $1,080 – a far cry from our expenses.
We took a closer look at some other areas that we could improve and noticed that AirDNA also shows a chart of amenities in the market. You see, amenities become less special when everyone else has them too. And hot tubs were at the very bottom of the list.
Could this be the silver bullet?!
I proceeded to check out every listing in the area that had a hot tub and noticed that each one of them had a higher than average occupancy. But there was only one problem.
We were in an apartment and there was no way we would be able to get a hot tub installed, so we improvised. One day while I was staring out the window at our empty porch, imaging a hot tub and a full calendar, the thought struck me.
“You can find almost anything on Amazon,” I thought. “I wonder if they make portable hot tubs…”.
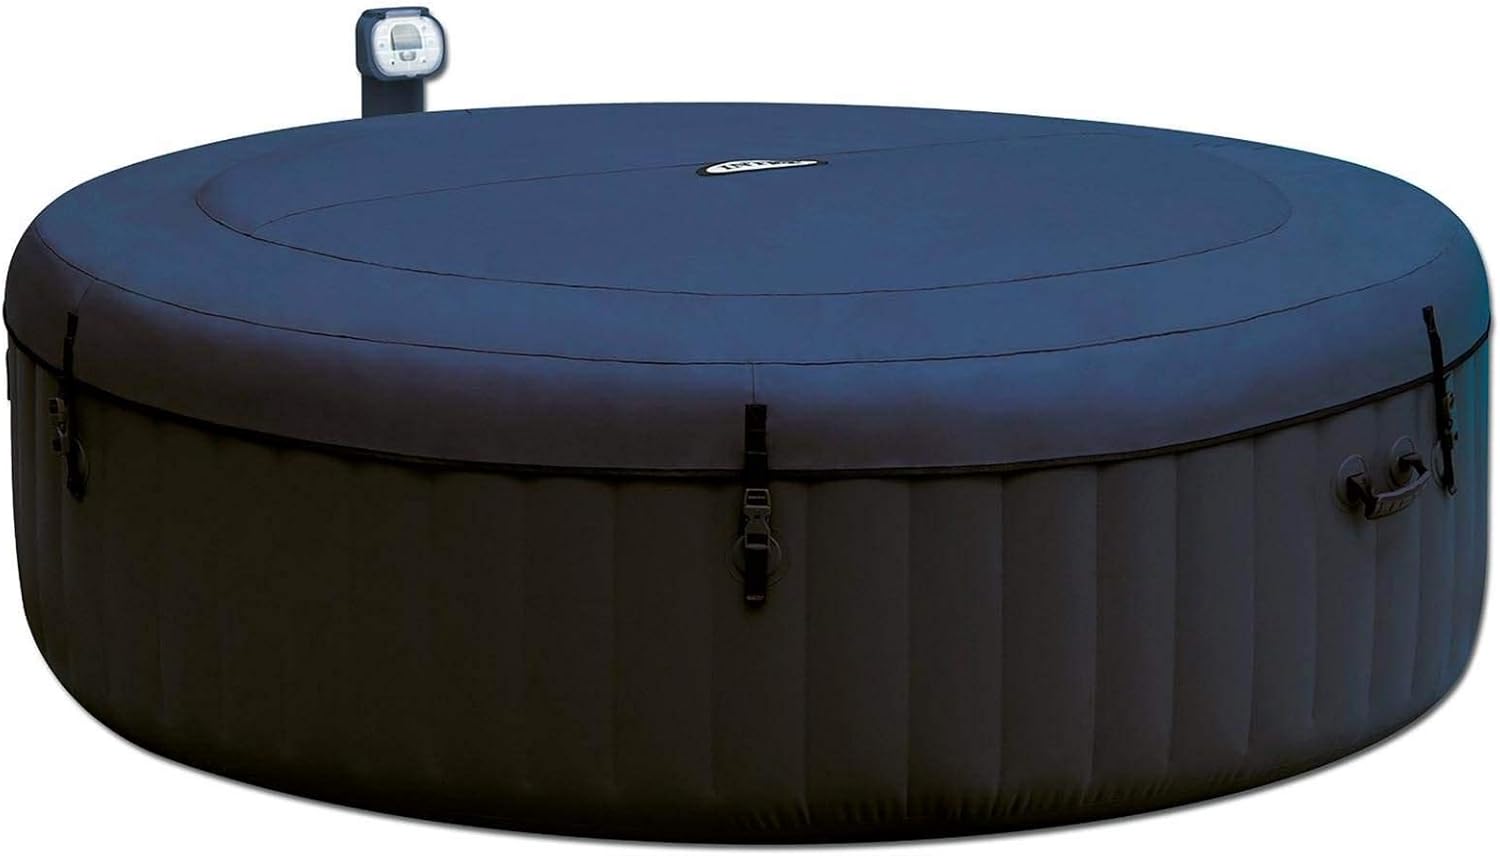
Turns out, they do make portable hot tubs!

Adding this to our listing made us stick out like a sore thumb and soon we were well over 70% occupancy!
It was 1/3rd the price of a traditional hot tub, easy to set up, surprisingly good quality, and wasn’t a permanent fixture for the building – i.e. perfect for a rental arbitrist with an AirBnB!
We wanted to know what impact the hot tub was having on our listing so we polled all of our guests, and every single one of them mentioned the hot tub being a factor in booking with us.
The hot tub put us in the search results, and our photos got people on to our listing. A one-two combo. However, the full force of the slow season was just beginning.
Winter was here, and not even a hot tub could help book travelers that don’t exist.
How AirDNA Could Have Saved $10,000
After everything was said and done, we ended up over $10,000 in the hole before we were able to turn our AirBnB around and start breaking even on our expenses.
If we had done the initial due diligence, like sensible investors are supposed to, we would have not even considered the property in the first place. At least not at the price we were paying.
The AirDNA data showed us that the market was too seasonal to sustain high rents and that the profitable months were almost exclusive to the Summer. We would have known that the properties that did well were outside of the city limits, and an apartment had major limitations.
It would have also helped us select which properties to go after, like a 1 bedroom cottage or 3+ bedroom house. Or we could have set up the apartment as a 1 bedroom with an office and hot tub from the very beginning.
So how does it all work?
What Is AirDNA?
AirDNA collects AirBnB host analytics from over 4,000,000 listings in over 80,000 different cities. They parse that information to chart historical data to spot trends and opportunities.
There are two main products:
MarketMinder, which is a subscription based product for researching local market data for short term rentals on platforms like AirBnB, Vrbo, and Homeaway.
It’s main function is to track occupancy, average daily rates, amenities, etc.
And Investment Explorer, which is also a subscription based product for digging deeper into the property values of a given area to spot short term rental opportunities for property investors.
This is where you can spot properties that are for sale which may be the most profitable.
Who Is AirDNA For?
Property investors looking for areas with high ROI.
AirDNA breaks down the rental data in a given market.
Investors looking to purchase properties can get an idea of which way the market is trending and whether or not there is enough growth or if trouble is on the horizon.
If average rental income is decreasing in one area, but increasing in another, then you will be able to investigate the cause to see if there are any opportunities.
Rental Arbitrists looking for opportunities to run a short term rental.
Because AirDNA scrapes data in over 80,000 cities, it’s easy to identify which areas present an opportunity for short term rentals.
Some areas of the country are saturated with listings and high competition with low occupancy, and identifying these areas are crucial before considering these properties.
Insights can also determine which types of properties to pursue and the best way to set them up.
Anyone looking for insights on how to optimize their listings.
If you’re already in a property, AirDNA can help point you in the right direction to close any gaps you may have with your listing.
For instance, which properties have the highest occupancy and what their prices are.
You will be able to determine where you rank and whether there is any room for improvement. See our story below for details.
How To Use AirDNA: Methodology

I’m sure the way AirDNA works is much more complicated, but this is how I was able to determine it.
Like many big-data analysis companies, AirDNA collects data from over 4,000,000 listings on the various platforms. All of this information is publicly available and tracked daily.
AirDNA submits this information to their database for analysis to determine where to graph the data for their reports.
They are able to determine true booked and blocked dates by analyzing historical data that they accumulated before AirBnB privatized this information, and by way of user submitted information. When you connect your listing to AirDNA, they are able to discern which dates are actually booked.
This gives AirDNA an advantage over other data-analysis companies because predictive algorithms are resolved based on actual data, not assumed.
To calculate potential revenue, actual daily rates and their cleaning fees are considered instead of advertised rates (which are often used as a way to strategically gain top spots in the AirBnB algorithm.)
To define an active property on AirBnB, AirDNA looks at properties that are available to book over the course of the whole month, so inactive listings don’t skew the results as being occupied.
So let’s take a quick tour behind the scenes.
Overview Of Short Term Rental Trends

The overview section is where you’re going to get the big picture of how well a short term rental is doing in a given market or neighborhood. This is where you’ll find the aggregate of the average daily rate, occupancy, and revenue.
However, our mistake was looking at this information at face value – because the devil really is in the details.
- “Active Rentals” will give you an overview of how many competitors are in your area and what they consist of (entire homes, shared rooms, or private rooms.)
- The “Rental Size” section gives a birds eye view on how many types of a property there are. However, this can be deceiving as will be explained later. Just because there aren’t many 2 bedroom properties does not necessarily make that an opportunity.
- “Rental Growth” shows you which way an area is trending when it comes to active listings. If you’re seeing a 15% quarterly growth, that means there will be 74% more competitors by the end of the year, because it compounds. So 62 active listings are predicted to turn into 108.
- The “Amenities” section doesn’t go too in-depth, but it does show you which ones are most common and it helps to spot any gaps that are in the market. For instance, in our area it was clear that hot tubs and pools weren’t offered by many properties, so we capitalized on it.
Occupancy

The occupancy section is where you’ll be able to dig into the details and see how each property type performs, how much rental demand there is, and how many active listings there are.
At first glance you will get to see an average of the whole, but digging in deeper will reveal where the opportunities actually are.
- “Historical Occupancy” is extremely important information to know. This reveals how well each property type was able to stay occupied at the 90th, 75th, 50th, and 25th percentile. Meaning, what occupancy is considered average vs doing better than 90% of other listings. You can dial it in even further and see what the occupancy looks like for an entire house, shared room, and private room.
- Under the “Active Listings” section, you will find the growth of each property type over time, and sort by how many bedrooms or guests can be accommodated.
- The “Demand Growth” section seems kind of redundant at first, but is actually useful for determining potential demand in an area. Under this section you can find how many properties were booked and for how long. For instance, 370 nights booked by 39 properties indicates an average of only 10 booked nights per property (a 33% occupancy). There were a whole lot of empty calendars!
Price/Rates

This is where the money is, but only literally. The Price/Rates section details the average daily rates and the high/low ranges you can expect from an individual property type.
This is important, because you’ll get a better idea on what to expect during the high and low season. But it goes into more detail as well.
The average daily rates will vary based on how many bedrooms and guests that can be accommodated, and if you track this data it can reveal some insights that might have missed.
For instance, the graph above (information not shown) revealed that the range of the average daily rate for the 95th percentile was $84 and only $80 for the 5th percentile in September, $4/night apart.
Revenue
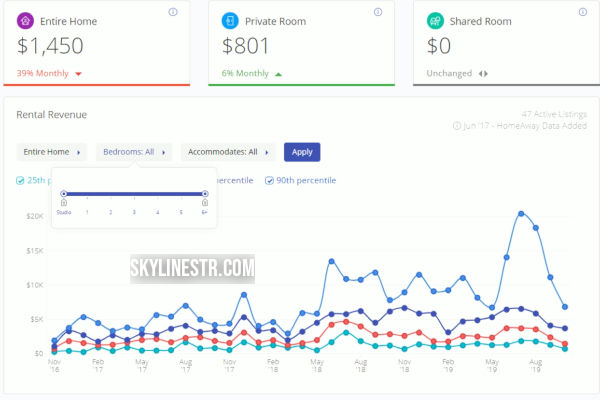
There are only two graphs to look at under this section, Rental Revenue and Historical Revenue, but they are incredibly important.
If you look at the chart above, you’ll see how the average of the market is doing, which can be deceptive. Because the 90th percentile (properties that are doing better than 90% of the market) are doing REALLY well.
The 75th percentile and below is another story.
Graphing out the historical data based on each property type, number of bedrooms and guests paints a much more meaningful picture, one that we will talk about later.
Guests

The “Guests” section also reveals some very interesting data and has information on the origins of domestic and international guests. Seeing that only 2% of guests for this area are international will tell us a bit more about what to expect.
The top guest cities also reveal some very important information, because it will determine the type of marketing that we do. Seattle is less than 100 miles away from this town, yet it accounts for a majority of the guests that book here.
Why?
Figuring this out will help us understand the type of traveler we are dealing with, and what to charge. My guess? They aren’t here for pleasure.
Likely they are working in the area and don’t want to commute. Or maybe couples are looking to get away from the children for an evening.
Future Rates

“Future Rates” are pretty straight forward and will help you plan out your prices over the course of the year.
While there is something to be said about dynamic pricing, here we can see just how much of a swing a property can have during each season – and which ones are more stable.
Does a 3 bedroom have to drop their rates to rock bottom during the winter? Will studios be booked all year round, and at what price?
Seasonality

“Seasonality” and “Booking Lead Time” are also really useful charts to look at.
You can separate them by each property type, number of bedrooms and guests as well. This gives a more realistic view on which months are empty and what the rates tend to be.
Booking lead time will allow you to make pricing decisions based on how far in advance your calendar is empty.
For instance, if the lead time for a 2 bedroom property in the Summer is 90 days – it means people are making plans much further in advance and demand tends to be higher.
However, if you just launch your property and are trying to get immediate bookings then you may need to drop prices for last minute.
It can also be an indicator of performance too.
Say the average booking lead time for February is 14 days. By the middle of January you would want to see your calendar for February start to fill up, and if you have no bookings by the 1st then something is wrong.
Final Thoughts On AirDNA
Regardless of how accurate the data is, we found it very close to what our numbers were and what we were experiencing “in the field.”
So is AirDNA worth it?
Let me put it this way, what took us months to learn by experience could have been seen at a glance and saved us from losing $10,000. A day or two of going through the data with a fine-tooth comb and charting everything out would have given us an even greater picture of potential earnings.
Or potential losses.
Seeing that our best hope to make a profit was in the Summer meant that we would be working full-time all year just to break even. Just so we could earn the salary of a month or two at a day job during the peak season.
And we could have known that, quickly.
There are many detractors out there about why AirDNA is not worth the measly $20-$40, but once you lose $10,000 and struggle as much as we did to turn things around, I doubt you will skip getting the data again.
We sure wont be.
Links
- Interested in getting the data to maximize your ROI? Check out the official AirDNA website.
- Will a hot tub boost your occupancy too? This is the one we got from Amazon.
- Want to improve your image and attract more guests with photography/videos? Click here to get started.
If you found our story and this AirDNA review helpful, please share it with a friend!
Our AirDNA Review After Losing Over $10,000 | Skyline STR
In our AirDNA review, we tell the story of how we lost over $10,000 and how we used AirDNA to save our rental, what metrics it covers, and more.


4 comments
Selena Desanti
You’re a great writer! Thank you for the tips and the tutorial on how to use AIRDNA. I will definitely purchase a report using your link.
Benjamin Harty
Thank you for the compliment, and you’re very welcome!
Valencia
Very helpful. I am going to become a host and have been researching a lot. So I’m definitely going to be paying for Airdna. Thanks
Benjamin Harty
I wish you well on your business!